Where California Tents Its Houses: Fumigation and Pest Treatment per Home, by County
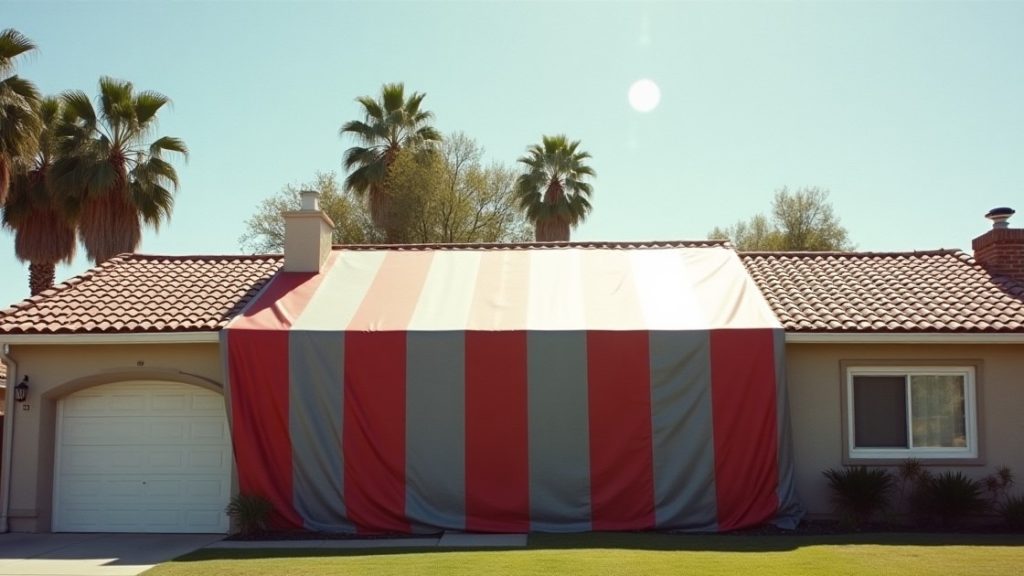
Key result: Santa Barbara County recorded 23.1 structural fumigations per 1,000 housing units in 2022, almost four times the California rate of 6.3. Ten coastal counties hold 84.5 percent of the state’s fumigations. Everyday pest treatment runs the other way: Fresno leads at 2.55 applications per housing unit.
Counting treatments against the housing stock
Raw county totals mostly restate where people live. Our analysis of what structural pest control applies found Los Angeles County used 27.6 percent of the state’s structural pesticide pounds, which says more about its 3.6 million homes than about its pests.
This report divides each county’s reported structural pest control work by its housing units. Two measures come out of the state’s pesticide use reports: applications of any kind, and fumigations with sulfuryl fluoride, the gas used to tent whole buildings. Each is set against the US Census Bureau’s housing unit estimate for the same county and year.
The fumigation coast
| County | Fumigations, 2022 | Per 1,000 housing units, 2022 | Per 1,000 housing units, 2023 |
|---|---|---|---|
| Santa Barbara | 3,719 | 23.1 | 15.6 |
| Santa Cruz | 1,576 | 14.8 | 14.4 |
| San Diego | 16,887 | 13.5 | 11.8 |
| Orange | 13,708 | 12.0 | 11.6 |
| San Luis Obispo | 1,473 | 11.7 | 7.5 |
| Monterey | 1,568 | 10.8 | 9.4 |
| Santa Clara | 6,724 | 9.6 | 8.4 |
| Ventura | 2,325 | 7.9 | 7.5 |
| Los Angeles | 27,738 | 7.6 | 5.8 |
| San Mateo | 1,589 | 5.5 | 4.7 |
| California | 91,524 | 6.3 | 5.3 |
| San Francisco | 11 | 0.03 | 0.03 |
Sources: California Department of Pesticide Regulation, Pesticide Use Reports 2022 and 2023, site code 10, sulfuryl fluoride applications by county of use; US Census Bureau, Annual Estimates of Housing Units for Counties in California, July 2022 and July 2023. Author calculation.
What it means. Tenting is a coastal practice, and a specific stretch of coast. The ten counties above, from San Mateo south to San Diego, recorded 84.5 percent of all structural fumigations in California in 2022. At Santa Barbara’s 2022 rate, roughly one housing unit in 43 was associated with a fumigation that year. Ten counties, all inland, mountain or far north, recorded none. San Francisco, coastal and dense, recorded 11.
What limits it. Fumigations include commercial buildings as well as homes, so the rate is fumigations relative to the housing stock, not the share of homes tented. Some buildings are fumigated more than once. The 2022 to 2023 drop in Santa Barbara, from 23.1 to 15.6, shows that a single county can move substantially between years; the statewide rate also fell, from 6.3 to 5.3. This report measures where fumigation happens, not why. It does not measure termite pressure, which our termite zones map covers.
Everyday treatment follows a different map
Fumigation is under 1 percent of structural applications. The other 99 percent, sprays, baits, gels and rodent stations, has its own geography.
| County | Applications per housing unit, 2022 | 2023 |
|---|---|---|
| Fresno | 2.55 | 2.77 |
| Riverside | 2.05 | 2.43 |
| Kern | 2.02 | 1.56 |
| Merced | 1.88 | 1.79 |
| Yolo | 1.88 | 1.62 |
| San Diego | 1.74 | 1.76 |
| Placer | 1.54 | 1.67 |
| California | 1.25 | 1.27 |
| Los Angeles | 1.03 | 1.08 |
| Alameda | 0.77 | 0.64 |
| Santa Clara | 0.75 | 0.80 |
| San Mateo | 0.66 | 0.71 |
| Sonoma | 0.51 | 0.49 |
| San Francisco | 0.41 | 0.40 |
Sources: as above, all structural applications by county of use. Counties with 50,000 or more housing units, which together hold 97.0 percent of California’s housing. Author calculation.
What it means. The counties with the most routine pest treatment per home are in the hot interior: the San Joaquin Valley, Riverside and the Sacramento Valley. Fresno County recorded 879,956 structural applications for 345,014 housing units in 2022. The Bay Area sits at the bottom, with San Francisco at about one application for every two and a half housing units.
What limits it. Applications are what businesses report on monthly summaries, so a route that services the same bait stations every month generates an application each visit. A county with many recurring service contracts will rank high regardless of how bad its pests are. Commercial and institutional work is included in the numerator but only housing units are in the denominator.
Two geographies, one industry
What it means. The two measures barely line up. Fresno has the highest rate of routine treatment and a below-average fumigation rate. Santa Barbara has the highest fumigation rate and a below-average rate of routine treatment. This matches what our licence census found at the level of businesses: the licences applying the most fumigant and the licences making the most applications are almost never the same. The fumigation business and the route-service business are different markets in different places.
What limits it. Thirty-five counties is a small sample for a visual pattern, and county averages hide large differences within big counties such as Los Angeles and San Bernardino.
How stable is the ranking?
Method. We ranked the 35 counties with 50,000 or more housing units on each measure in 2022 and again in 2023, independently, and compared the rankings with a Spearman rank correlation, where 1 means identical order.
Result. 0.982 for fumigations per 1,000 housing units and 0.911 for applications per housing unit. The fumigation geography is close to fixed. The treatment geography is stable but moves more, mostly among counties near the middle.
Why the size cut matters. Small counties swing. Kings County went from 2.08 applications per housing unit in 2022 to 0.64 in 2023, and from 5.1 fumigations per 1,000 units to 0.1. Colusa, Glenn and Sutter top the unfiltered list on fewer than 35,000 housing units each. All 58 counties are in the CSV, with both years, so readers can apply their own threshold.
Measures in this report
1. Fumigation rate
Definition. Structural sulfuryl fluoride applications per 1,000 housing units.
Formula. Sum of the application count on site code 10 reports for sulfuryl fluoride in the county, divided by the county’s July housing unit estimate, times 1,000.
Result. 6.3 statewide in 2022 and 5.3 in 2023; from 0 to 23.1 across counties.
Limitations. Not the share of homes fumigated, because commercial buildings are included and repeat fumigations count twice.
2. Treatment intensity
Definition. All structural pesticide applications per housing unit.
Formula. Sum of the application count on all site code 10 reports in the county, counted once per report, divided by housing units.
Result. 1.25 statewide in 2022 and 1.27 in 2023.
Limitations. Reflects service models as well as pest pressure.
3. Coastal fumigation share
Definition. The share of all California structural fumigations recorded in the ten counties with the highest fumigation rates.
Result. 84.5 percent in 2022.
Limitations. The ten are chosen by their rate, so the share is descriptive, not a test.
Related: how fumigation has changed since 2016 is in California is tenting fewer buildings.
Download the data
The tables in this report are published as CSV files under a Creative Commons Attribution 4.0 licence. You may republish, remix and build on them, including commercially, with attribution to The Pest Control Brief and a link to this page.
- All 58 California counties: housing units, population, applications, fumigations, pounds and reports, with rates, 2022 and 2023 (CSV, 58 rows)
How to cite this report
The Pest Control Brief, “Where California Tents Its Houses: Fumigation and Pest Treatment per Home, by County”, 2 October 2026. https://thepestcontrolbrief.com/california-fumigation-by-county/
References
- California Department of Pesticide Regulation. Pesticide Use Report annual archives for 2022 and 2023. files.cdpr.ca.gov/pub/outgoing/pur_archives/. Accessed 2 October 2026. Fields used: county_cd, site_code, chem_code, applic_cnt, lbs_chm_used.
- California Department of Pesticide Regulation. PUR field definitions, readme_excel.xlsx, supplied inside the 2023 archive.
- US Census Bureau. Annual Estimates of Housing Units for Counties in California: April 1, 2020 to July 1, 2023 (CO-EST2023-HU-06). www2.census.gov CO-EST2023-HU-06.xlsx. Accessed 2 October 2026.
- US Census Bureau. County population totals, Vintage 2023 (co-est2023-alldata). www2.census.gov co-est2023-alldata.csv. Accessed 2 October 2026. Population is included in the CSV for readers who prefer a per-person rate.
How the county figures were built
Scope. Every 2022 and 2023 Pesticide Use Report record with site code 10, Structural Pest Control, assigned to the county in which the use was reported.
Applications. The application count field, counted once per report for all-ingredient totals. Fumigations are the application counts on reports naming sulfuryl fluoride, chemical code 618.
Denominator. Census Bureau housing unit estimates as of 1 July of the same year, matched to the department’s county codes by name.
Limitations. California only. Reports state the county of use but not the type of building. About 12 percent of licences state no application count on some or all reports, which leaves those applications uncounted. Two years.
Last reviewed: 2 October 2026.
For reporters and local editors
Most quotable statistics
- Santa Barbara County recorded 23.1 structural fumigations per 1,000 housing units in 2022, almost four times the California rate of 6.3.
- Ten coastal counties from San Mateo to San Diego recorded 84.5 percent of California’s 91,524 structural fumigations in 2022.
- Los Angeles County recorded 27,738 structural fumigations in 2022, the most of any county, at 7.6 per 1,000 housing units.
- Fresno County recorded 2.55 pest control applications per housing unit, double the state rate of 1.25.
- San Francisco recorded 11 structural fumigations in 2022 and 0.41 applications per housing unit, the lowest rates of any large county.
Localising it
The CSV has every county with both years. For a county under 50,000 housing units, quote both years, because single-year rates in small counties are volatile.
Press summary
Whole-house tenting in California is concentrated on a strip of coast from San Mateo to San Diego, according to an analysis of state pesticide use reports by The Pest Control Brief. Santa Barbara County recorded 23.1 structural fumigations per 1,000 housing units in 2022, against 6.3 for the state, and ten coastal counties accounted for 84.5 percent of all 91,524 structural fumigations. Routine pest treatment follows a different map, led by the hot interior: Fresno County recorded 2.55 applications per housing unit, twice the state rate, while San Francisco recorded 0.41. Both rankings repeated closely in 2023.
Headlines editors could use
- Where California tents its houses: the fumigation coast, county by county
- Santa Barbara fumigates at four times the California rate
- Fresno leads California in pest treatments per home
- San Francisco recorded 11 structural fumigations in a year. Orange County recorded 13,708
Questions readers ask
Which California county has the most termite tenting?
By number, Los Angeles County, with 27,738 structural fumigations in 2022. Relative to its housing, Santa Barbara County, at 23.1 per 1,000 housing units, followed by Santa Cruz at 14.8 and San Diego at 13.5.
How common is house fumigation in California?
California recorded 91,524 structural fumigations in 2022, 6.3 for every 1,000 housing units, and 78,398 in 2023. Commercial buildings are included in those counts.
Why is fumigation so concentrated on the coast?
These data show where it happens, not why. The pattern is stable between years. Termite species and building types are the usual explanations, which this report does not test.
Which California county uses the most pest control?
Relative to its housing, Fresno County among large counties, at 2.55 applications per housing unit in 2022 and 2.77 in 2023.
Why does San Francisco have so little?
It recorded 11 structural fumigations and 0.41 applications per housing unit in 2022. These data do not explain why; building type and service models are possible factors.
Does a high rate mean worse pests?
Not necessarily. Application counts reflect service contracts and business models as well as pest pressure.
Are commercial buildings included?
Yes. Structural pest control covers all buildings. The rate is per housing unit because that is the best available measure of the building stock.
Where can I get my county’s numbers?
All 58 counties, both years, are in the CSV above.