California Is Tenting Fewer Buildings
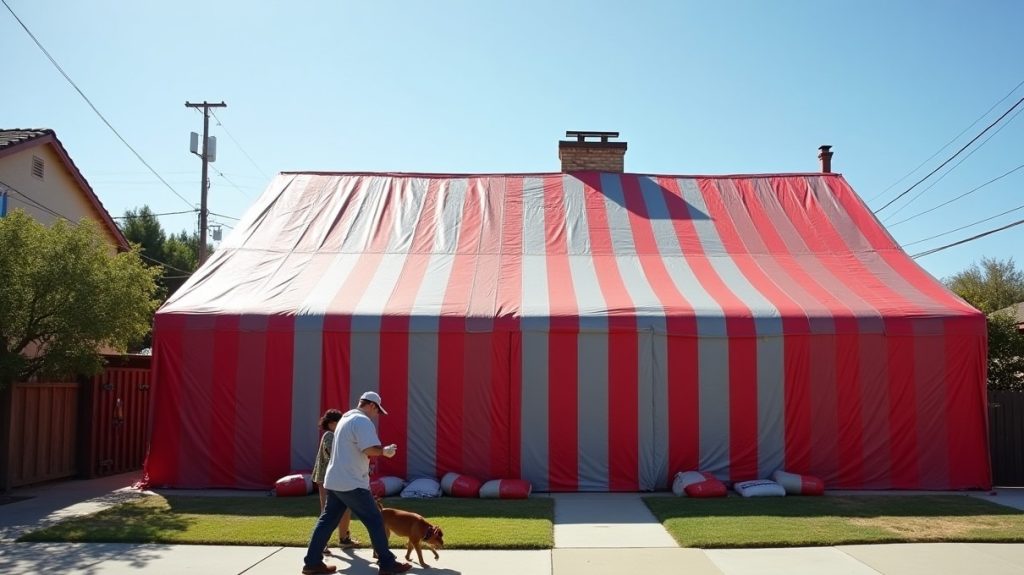
Key result: California recorded 78,398 structural fumigations in 2023, down from 102,490 in 2016, a fall of 23.5 percent, while all other structural pest control applications rose 33.2 percent. Fumigant pounds fell 17.3 percent. The largest declines were in Orange, Santa Clara and Los Angeles counties.
One treatment going the other way
Our eight-year analysis of California pest control chemistry found structural applications up 32.8 percent from 2016 to 2023. Whole-building fumigation with sulfuryl fluoride, the tenting treatment used mainly against drywood termites, did the opposite.
California’s pesticide use reports record every structural fumigation, county by county, as the number of applications and the pounds of fumigant. We read all eight annual archives from 2016 to 2023.
The statewide decline
| Year | Fumigations | Fumigant pounds | Share of structural applications |
|---|---|---|---|
| 2016 | 102,490 | 2,769,050 | 0.72% |
| 2017 | 105,160 | 2,676,199 | 0.71% |
| 2018 | 98,398 | 2,485,481 | 0.65% |
| 2019 | 98,056 | 2,476,752 | 0.66% |
| 2020 | 90,323 | 2,236,380 | 0.58% |
| 2021 | 98,587 | 2,453,923 | 0.58% |
| 2022 | 91,524 | 2,623,381 | 0.50% |
| 2023 | 78,398 | 2,291,064 | 0.42% |
Source: California Department of Pesticide Regulation, Pesticide Use Reports 2016 to 2023, site code 10, sulfuryl fluoride (chemical code 618). Fumigations are the application counts the monthly reports state. Author calculation.
What it means. Fumigation’s share of structural pest control work has fallen by 42 percent in eight years, from 0.72 to 0.42 percent of applications. Measured either way, fumigation in 2022 and 2023 was below its 2016 and 2017 level: by 18.2 percent comparing two-year averages of fumigations, and by 9.7 percent comparing two-year averages of pounds.
What limits it. 2023 needs care. 436 fumigation reports that year stated no application count, against 268 in 2022, so the 2023 fumigation count is understated; that is why pounds, which are recorded for every report, fell less. The 2022 pound total includes three Riverside County reports totalling 267,464 pounds for 17 fumigations, about 15,700 pounds each against a typical 28, which may be very large structures or entry errors; without them, the 2022 pound total would be about 10 percent lower.

Where it fell
| County | Fumigant pounds, 2016-17 average | 2022-23 average | Change in pounds | Change in fumigations |
|---|---|---|---|---|
| Los Angeles | 840,492 | 714,341 | −15.0% | −24.9% |
| San Diego | 459,282 | 405,253 | −11.8% | −18.2% |
| Orange | 422,592 | 319,491 | −24.4% | −20.3% |
| Santa Clara | 197,709 | 148,322 | −25.0% | −25.1% |
| Ventura | 103,415 | 85,745 | −17.1% | +37.2% |
| Santa Barbara | 74,018 | 70,065 | −5.3% | −1.3% |
| Alameda | 64,794 | 67,830 | +4.7% | −0.7% |
| Santa Cruz | 45,181 | 53,008 | +17.3% | −0.9% |
Source: as above, by county of use. Two-year averages smooth single-year swings. The full series for 16 counties is in the CSV. Author calculation.
What it means. The decline is concentrated in the largest fumigation markets of Southern California and Silicon Valley. Orange and Santa Clara counties fell by about a quarter on both measures. Los Angeles, the largest market, fell 15 to 25 percent depending on the measure. The Central Coast and the East Bay held steady. Our county map of fumigation intensity shows these are the same coastal counties that fumigate most per home.
What limits it. Where pounds and fumigation counts disagree, as in Ventura, the gap usually reflects reports without an application count or a change in the size of buildings treated. Neither measure is a count of homes.
What the data cannot say about why
The reports record what was applied, not why. Several explanations are possible and none can be tested here: more termite work done with localised treatments instead of whole-building fumigation, changes in the housing stock, cost, or fewer termite infestations. Our analysis of pest control illness reports found fumigation accounted for 116 of 135 reported illness cases from 2016 to 2023, and our report on sulfuryl fluoride as a greenhouse gas covers the climate debate around it; neither shows that these concerns changed demand.
Checks on the trend
1. Two measures
Result. Fumigations fell 23.5 percent from 2016 to 2023 and fumigant pounds 17.3 percent. Comparing two-year averages, 18.2 and 9.7 percent. Every version shows a decline while the rest of structural pest control grew by a third.
2. Not a reporting artefact of 2023 alone
Result. Fumigation’s share of applications fell from 0.72 percent in 2016 to 0.50 percent in 2022, with only two small year-on-year rises, before the 2023 reporting gap.
3. Complete series
Result. All eight archives, 58 county files each, read in full.
Related: whether other termite treatments replaced tenting is in eight years of termite treatments.
Download the data
The tables in this report are published as CSV files under a Creative Commons Attribution 4.0 licence. You may republish, remix and build on them, including commercially, with attribution to The Pest Control Brief and a link to this page.
- Statewide fumigations, pounds, reports and share of applications, 2016 to 2023 (CSV, 8 rows)
- Fumigant pounds and fumigations by county and year, 16 counties (CSV, 128 rows)
How to cite this report
The Pest Control Brief, “California Is Tenting Fewer Buildings: Fumigation Fell While the Rest of Pest Control Grew a Third”, 2 October 2026. https://thepestcontrolbrief.com/california-termite-fumigation-decline/
References
- California Department of Pesticide Regulation. Pesticide Use Report annual archives, 2016 to 2023. files.cdpr.ca.gov/pub/outgoing/pur_archives/. Accessed 2 October 2026.
- California Department of Pesticide Regulation. PUR field definitions, readme_excel.xlsx, supplied inside the 2023 archive. Defines the application count for non-agricultural monthly summary reports.
How the series was built
Scope. Every Pesticide Use Report record with site code 10 and chemical code 618, sulfuryl fluoride, from 2016 to 2023.
Measures. Fumigations are the sum of the application count field; pounds are the active ingredient pounds field. Other applications are all site code 10 applications minus fumigations.
Limitations. Reports without an application count contribute pounds but no fumigations. Site code 10 covers all buildings, not only homes. Commodity and other non-structural fumigation is excluded.
Last reviewed: 3 October 2026.
For real estate and trade reporters
Most quotable statistics
- California recorded 78,398 structural fumigations in 2023, down from 102,490 in 2016.
- Over the same period all other structural pest control applications rose 33.2 percent.
- Fumigation’s share of structural pest control applications fell from 0.72 to 0.42 percent.
- Fumigant pounds fell 24 to 25 percent in Orange and Santa Clara counties between 2016-17 and 2022-23.
Caveats that travel with them
2023 fumigation counts are understated by reports without a count; pounds fell 17.3 percent. The data do not explain why fumigation fell.
Press summary
Whole-building termite fumigation is declining in California even as the rest of pest control grows, according to an analysis of eight years of state pesticide use reports by The Pest Control Brief. The state recorded 78,398 structural fumigations in 2023, against 102,490 in 2016, while other structural applications rose by a third. Fumigation’s share of pest control work fell from 0.72 to 0.42 percent of applications. The largest declines were in Orange, Santa Clara and Los Angeles counties.
Headlines editors could use
- California is tenting fewer buildings
- Termite fumigation down a fifth as pest control grows a third
- The decline of the tent: eight years of California fumigation data
Questions about the decline
Is termite tenting becoming less common in California?
Yes, on state records. Structural fumigations fell from 102,490 in 2016 to 78,398 in 2023, and their share of pest control applications from 0.72 to 0.42 percent.
How many houses are fumigated in California each year?
About 80,000 to 105,000 structural fumigations a year from 2016 to 2023, including commercial buildings.
Which counties fumigate less than before?
Orange and Santa Clara fell about a quarter on both measures; Los Angeles 15 to 25 percent; Kern about half, from a smaller base.
Why is fumigation declining?
These data cannot say. Localised treatments, housing changes, cost and termite pressure are all possible explanations.
Is fumigation still the biggest pesticide use in pest control by weight?
Yes. Sulfuryl fluoride remained about two thirds of structural pesticide pounds in 2022 and 2023.
Where can I get the yearly figures?
Statewide and county series are in the CSV files above.