Imidacloprid Exceeds EPA’s Stream Benchmark in 30 Percent of Samples
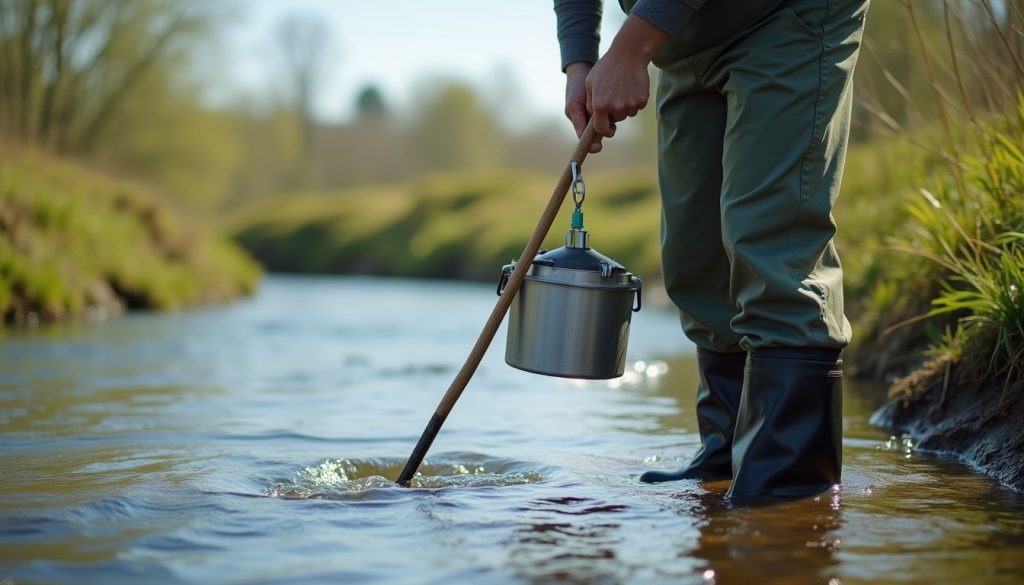
Key result: Imidacloprid exceeded EPA’s chronic benchmark for freshwater invertebrates in 30.1 percent of 34,686 US stream samples from 2015 to 2025, at 1,611 sites. For four pyrethroids, the benchmarks sit below every laboratory limit in the record, so no non-detect can show a stream meets them.
Detection is not risk; benchmarks are the next step
Our analysis of insecticides in US streams measured how often five pest control insecticides are found. Our audit of the monitoring record corrected those rates for hidden non-detects and extended them to 14 compounds. Neither asked whether the concentrations matter.
The US Environmental Protection Agency publishes aquatic life benchmarks for registered pesticides: concentrations below which it does not expect effects on fish, invertebrates or plants. This report compares every measured concentration of 14 insecticides in US stream water since 2015 with EPA’s benchmarks for freshwater invertebrates, the group most sensitive to insecticides.
The chronic benchmark applies to longer exposures and is the stricter of the two; the acute benchmark to short exposures. A single grab sample is a snapshot, so exceeding a chronic benchmark in one sample does not prove a chronic exposure. We use the comparison as a screen.
The benchmarks
| Compound | Chronic, freshwater invertebrates | Acute, freshwater invertebrates | Benchmark year |
|---|---|---|---|
| Imidacloprid | 10 ng/L | 385 ng/L | 2017 |
| Clothianidin | 50 ng/L | 11,000 ng/L | 2016 |
| Thiamethoxam | 740 ng/L | 17,500 ng/L | 2017 |
| Dinotefuran | greater than 95,300,000 ng/L | greater than 484,150,000 ng/L | 2016 |
| Fipronil | 11 ng/L | 110 ng/L | 2021 |
| Bifenthrin | 0.05 ng/L | 0.25 ng/L | 2021 |
| Deltamethrin | 0.026 ng/L | 0.10 ng/L | 2021 |
| Esfenvalerate | 0.031 ng/L | 0.42 ng/L | 2021 |
| Cyfluthrin | 0.12 ng/L | 12.5 ng/L | 2021 |
| Permethrin | 4.2 ng/L | 3.3 ng/L | 2021 |
| Chlorpyrifos | 40 ng/L | 50 ng/L | 2022 |
| Pyriproxyfen | 15 ng/L | 200,000 ng/L | 2016 |
| Chlorfenapyr | 3,570 ng/L | 2,915 ng/L | 2016 |
| Indoxacarb | 75,000 ng/L | 300,000 ng/L | 2014 |
Source: US Environmental Protection Agency, Aquatic Life Benchmarks and Ecological Risk Assessments for Registered Pesticides, last updated 2 February 2026, converted from micrograms to nanograms per litre. ng/L is nanograms per litre, or parts per trillion.
What it means. The benchmarks span more than ten orders of magnitude. The pyrethroids’ are measured in hundredths of a nanogram per litre; dinotefuran’s is listed only as greater than 95 million, meaning no effect was seen at the highest concentration EPA’s 2016 assessment considered. Dinotefuran’s chronic benchmark is nearly 10 million times imidacloprid’s, although both are neonicotinoids.

How often streams exceed them
| Compound | Samples | Measured values | Above chronic benchmark | Share of all samples | Share of measured values | Above acute benchmark | Sites with an exceedance |
|---|---|---|---|---|---|---|---|
| Imidacloprid | 34,686 | 14,423 | 10,445 | 30.1% | 72.4% | 251 | 1,611 of 3,786 |
| Clothianidin | 16,674 | 3,672 | 809 | 4.9% | 22.0% | 0 | 151 of 2,425 |
| Bifenthrin | 21,497 | 567 | 567 | 2.6% | 100% | 536 | 216 of 1,655 |
| Fipronil | 23,763 | 3,994 | 427 | 1.8% | 10.7% | 12 | 145 of 2,491 |
| Cyfluthrin | 12,448 | 90 | 90 | 0.7% | 100% | 20 | 47 of 912 |
| Chlorpyrifos | 34,050 | 885 | 234 | 0.7% | 26.4% | 204 | 88 of 3,007 |
| Permethrin | 5,268 | 68 | 34 | 0.6% | 50.0% | 38 | 26 of 898 |
| Deltamethrin | 2,911 | 17 | 17 | 0.6% | 100% | 17 | 13 of 461 |
| Esfenvalerate | 11,651 | 36 | 36 | 0.3% | 100% | 32 | 21 of 804 |
| Thiamethoxam | 15,830 | 2,773 | 44 | 0.3% | 1.6% | 0 | 26 of 2,347 |
| Pyriproxyfen | 12,486 | 15 | 4 | 0.03% | 26.7% | 0 | 3 of 1,508 |
| Dinotefuran, chlorfenapyr, indoxacarb | 28,165 | 1,883 | 0 | 0% | 0% | 0 | 0 |
Source: Water Quality Portal, US stream sites, water results from 1 January 2015, with hidden non-detects corrected; EPA Aquatic Life Benchmarks. Author calculation.
What it means. Imidacloprid stands alone. When it is measured, it is above the chronic invertebrate benchmark nearly three times in four, and it was above it at some point at 42.6 percent of monitored stream sites. Every other compound is above its chronic benchmark in under 5 percent of samples. For the pyrethroids, every single measured value exceeds the benchmark, but measured values are rare, so the share of samples is small.
What limits it. These are measured exceedances, and so minimum shares. A non-detect with a laboratory limit above the benchmark could hide an exceedance, which is the subject of the next section. Monitored streams are not a random sample of US streams.
Benchmarks no laboratory in the record can see
What it means. For bifenthrin, cyfluthrin, deltamethrin and esfenvalerate, every non-detect with a recorded laboratory limit had that limit above EPA’s chronic benchmark. Bifenthrin’s benchmark is 0.05 ng/L. The lowest laboratory limit attached to any of its 20,033 non-detects is 0.7 ng/L, 14 times the benchmark; the median limit is 19 ng/L, 380 times it. A “not detected” result for these compounds therefore says the concentration was below the laboratory’s limit, not below the level EPA considers safe for invertebrates. The national record cannot show that any monitored stream meets these four benchmarks, and cannot show that any fails them either, except where a detection occurred.
Imidacloprid has the same problem on a smaller scale: two thirds of its non-detects, 67.1 percent, had a limit above its 10 ng/L benchmark, so the 30.1 percent exceedance rate is a floor. The same applies, less strongly, to clothianidin, 23.0 percent of whose non-detects had a limit above its benchmark, and to fipronil and chlorpyrifos, at about 10 percent each.
What limits it. Limits were available for most non-detects of the nine compounds for which we downloaded the portal’s detection-limit records, and for Florida results, where the reported value is the method detection limit. Indoxacarb non-detects had no recorded limits. Laboratories outside the portal may achieve lower limits.
Where imidacloprid exceeds most often
What it means. Among the 29 states with at least 200 imidacloprid samples, the share above the chronic benchmark ranges from 82.9 percent in Ohio and 82.5 in North Carolina to zero in Idaho and Montana. Florida, with 9,055 samples, by far the most, sits at 41.1 percent.
What limits it. State rates mostly reflect where each state’s programmes chose to sample, which differs: some target agricultural or urban streams, others sample broadly. A high rate in one state and a low rate in another is not a ranking of water quality.
What this says about pest control
Several of these compounds are structural pest control products, and our eight-year analysis of California pest control chemistry found neonicotinoid use in that market up 168 percent since 2016, led by dinotefuran. These data cannot attribute any stream concentration to any use. They do show that the compound with by far the most frequent benchmark exceedances, imidacloprid, is one the industry uses widely, and that the neonicotinoid growing fastest in pest control, dinotefuran, is assessed against a benchmark so high that no stream sample in the record approaches it.
Checks on the comparison
1. Corrected detections
Method. Only values that are genuine detections were compared with benchmarks; detection limits stored as values were excluded, using the rule set out in our monitoring audit.
Result. Without that correction, thousands of detection limits would have been counted as exceedances, including every Florida pyrethroid non-detect.
2. Benchmark mapping
Method. Read EPA’s published table by column position and checked the mapping against widely cited values: imidacloprid 0.01, clothianidin 0.05, thiamethoxam 0.74 and fipronil 0.011 micrograms per litre, all chronic freshwater invertebrate benchmarks.
Result. All four matched.
3. Acute as well as chronic
Result. 251 imidacloprid samples and 536 bifenthrin samples exceeded the acute benchmark as well. For bifenthrin the acute benchmark of 0.25 ng/L is also below every recorded laboratory limit.
Related: which compounds carry pest control’s aquatic toxicity is in pyrethroids and toxicity-weighted use, and how often insecticides occur together in insecticide mixtures in streams.
Download the data
The tables in this report are published as CSV files under a Creative Commons Attribution 4.0 licence. You may republish, remix and build on them, including commercially, with attribution to The Pest Control Brief and a link to this page.
- Benchmarks, samples, exceedances and non-detect limits for 14 insecticides (CSV, 14 rows)
- Chronic benchmark exceedances by state for imidacloprid, clothianidin, fipronil and bifenthrin (CSV, 180 rows)
How to cite this report
The Pest Control Brief, “Insecticides in US Streams Against EPA's Own Benchmarks: Imidacloprid Exceeds Them in 30% of Samples”, 2 October 2026. https://thepestcontrolbrief.com/insecticides-epa-aquatic-benchmarks/
References
- US Environmental Protection Agency. Aquatic Life Benchmarks and Ecological Risk Assessments for Registered Pesticides. Last updated 2 February 2026. epa.gov aquatic life benchmarks. Accessed 2 October 2026.
- Water Quality Portal. Result, Station and ResultDetectionQuantitationLimit searches, siteType=Stream, from 1 January 2015. waterqualitydata.us. Retrieved 25 September to 3 October 2026.
- The Pest Control Brief. The national pesticide monitoring record, audited. thepestcontrolbrief.com/national-pesticide-monitoring-reliability. Source of the detection rule.
How the comparison was made
Data. Every US stream-site water result since 1 January 2015 for 14 insecticides, with hidden non-detects corrected and programmes that never report a non-detect excluded.
Comparison. Each measured concentration, in nanograms per litre, against EPA’s chronic and acute benchmarks for freshwater invertebrates. A sample counts as an exceedance if its measured value is above the benchmark.
Limits. For each non-detect, the lowest recorded detection or reporting limit from the portal’s detection-limit records, or the reported value where a Florida U flag identifies it as the method detection limit.
States. From the monitoring location’s state code in the portal’s station records.
Limitations. Grab samples, not time-averaged exposure. Benchmarks are screening values. Monitoring is purposive. Benchmarks for other organism groups were not assessed.
Last reviewed: 3 October 2026.
For environmental reporters
Most quotable statistics
- Imidacloprid exceeded EPA’s chronic benchmark for freshwater invertebrates in 30.1 percent of 34,686 US stream samples from 2015 to 2025.
- It exceeded the benchmark at least once at 1,611 of 3,786 monitored stream sites.
- For bifenthrin, every laboratory limit in the record is above EPA’s 0.05 ng/L benchmark, so no non-detect can show a stream meets it.
- Dinotefuran’s invertebrate benchmark is nearly 10 million times imidacloprid’s; no stream sample comes close to it.
- In Ohio and North Carolina, more than 80 percent of monitored imidacloprid samples exceeded the chronic benchmark.
Caveats that travel with them
Single samples, not sustained exposure. Benchmarks are screening values. Monitored streams are chosen, not random. No attribution to pest control or any other use.
Press summary
Imidacloprid, a neonicotinoid insecticide used in agriculture and pest control, exceeds the US Environmental Protection Agency’s own benchmark for harm to freshwater invertebrates in 30 percent of US stream samples, according to an analysis of 34,686 samples from 2015 to 2025 by The Pest Control Brief. The exceedances occurred at 1,611 monitored sites. For four pyrethroid insecticides, including bifenthrin, EPA’s benchmarks are lower than any laboratory limit in the national record, meaning monitoring cannot show whether streams meet them. The analysis also notes that dinotefuran, the neonicotinoid growing fastest in California pest control, is assessed against a benchmark nearly 10 million times higher than imidacloprid’s.
Headlines editors could use
- Imidacloprid breaks EPA’s invertebrate benchmark in 30% of US stream samples
- The pesticide benchmarks no laboratory can measure
- Two neonicotinoids, benchmarks 10 million times apart
- Where US streams most often exceed EPA’s imidacloprid benchmark
Questions people ask
Does imidacloprid in streams exceed EPA limits?
EPA publishes benchmarks rather than legal limits. Imidacloprid exceeded the chronic benchmark for freshwater invertebrates, 10 ng/L, in 30.1 percent of US stream samples from 2015 to 2025.
What is an aquatic life benchmark?
A concentration EPA uses to screen monitoring data: below it, the agency does not expect effects on the organism group concerned. Chronic benchmarks apply to longer exposures, acute to short ones.
Why can’t monitoring show whether bifenthrin is safe for streams?
Because EPA’s benchmark, 0.05 ng/L, is lower than every laboratory limit recorded for bifenthrin in the national database. A non-detect means only that the concentration was below the laboratory’s limit.
Is dinotefuran safer than imidacloprid?
EPA’s benchmarks treat it as far less toxic to freshwater invertebrates; the dinotefuran benchmark dates from 2016 and is listed only as a lower bound. This report does not assess the toxicology.
Which states have the most imidacloprid exceedances?
Among states with at least 200 samples, Ohio (82.9 percent), North Carolina (82.5) and Mississippi (78.7). State rates reflect where programmes sample.
Does this mean streams are harmed?
A benchmark exceedance indicates potential for effects on sensitive invertebrates. It is not a measured effect.
Where can I get the data?
Both tables are in the CSV files above; the underlying results are free from the Water Quality Portal.